Imagine spending hours after practice, sifting through spreadsheets, trying to make sense of athlete performance data. What if you could reclaim that time and use it to actually coach? In today's competitive sports landscape, data is king. But only if you can interpret it and turn it into action.
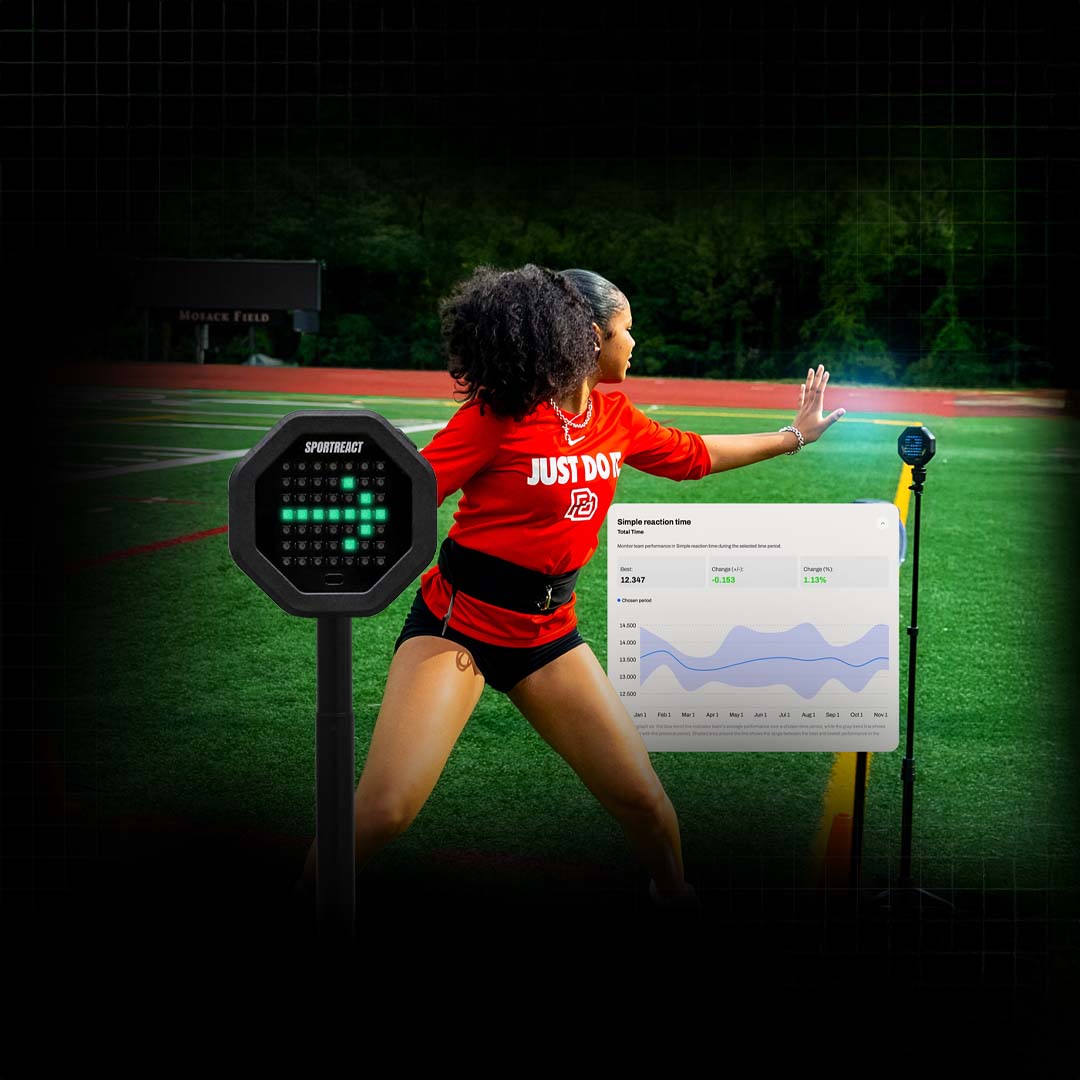
Sportreact revolutionized COD and agility training by integrating timing gates with a reaction time stimulus. But simply collecting data isn't enough. Sportreact PLUS takes it to the next level, providing the powerful analytics you need to truly understand and improve your athletes' speed, agility, and reaction time.
Sportreact PLUS simplifies performance analysis by automating every step of the process. Data is collected automatically, key metrics are calculated instantly, and comprehensive reports are generated at both the athlete and team levels. This includes rankings, benchmarks, and trend tracking, giving you a complete picture of performance and progress.
Understanding athlete performance requires more than just looking at individual scores. It’s about seeing the whole picture—individual progress, athlete comparisons, team-wide trends, and even variations within specific drills. Sportreact PLUS empowers you to personalize training, making it easy to identify strengths, spot weaknesses, and optimize programs for peak performance.
Let’s dive into how Sportreact Plus helps you reduce the toil and spend more time optimizing performance.
What is Sportreact PLUS?
Sportreact PLUS is a premium app upgrade that tracks and compares performance at every level — drill, athlete, and team.
Choose your report level with Sportreact PLUS
Our platform saves, organizes, and analyzes all your athlete and team data in one place, making it easy to identify strengths, spot weaknesses, and optimize training programs. Sportreact Plus users gain access to four powerful levels of analysis – individual, comparative, team, and rep-by-rep – while our free tier offers rep comparisons to get you started.
Sportreact Plus provides four key levels of analysis:
1. Athlete Profiling:
Track Individual Progress
Key metrics like velocity, acceleration, power, and force.
Progress tracking with trend graphs and change rates for every drill.
Benchmark against team averages and normative data.
2. Compare Athletes: See How They Stack Up
Easy results comparison across multiple drills.
Total ranking using standardised scores (t-scores, 0-100).
Spider graph data visualisation for viewing overall skill balance.
3. Team Analysis:
Get the Bigger Picture
Team-wide trends in sprints, agility, and reaction drills with aggregated data.
Athlete's position against team's average, highest and lowest scores.
Drill leaderboards and total percentile-based rankings across multiple drills.
4. Activity Report:
Catch Every Detail
In-depth analysis of every rep by tracking hits, total time and metrics.
Performance visualisations such as line graphs, bar charts, and spider graphs.
Rep rankingwith leaderboard tables.
1. Athlete Profiling: Track Individual Progress
Athlete analytics enable the coach to:
Track Athlete Progress:
Store all sprint, agility and reaction drill/test results in one place.
View total times and splits, and access calculated metrics like acceleration, velocity, power, and force.
View trend graphs and change rates to monitor progress over a season or years.
Compare Performance:
Compare each athlete’s results to team-wide data.
(BETA) Benchmark performance against normative results for their sport, age and sex.
Meet "Athlete Profiling"
a) View each athlete's key info
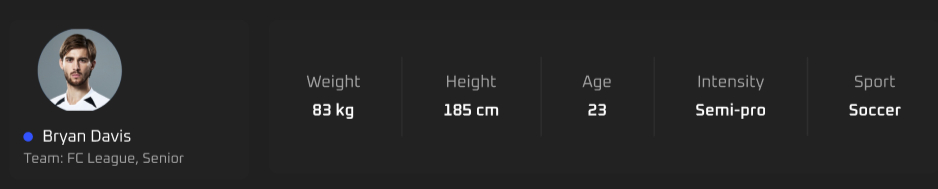
Athlete profile stores the important information about each athlete: in addition to name, photo, and team, it shows height, weight, age, level, and the sports that the athlete trains. A fully completed profile allows coaches to access calculations of velocity, acceleration, power, and force in sprints, as well as the comparison with normative results.
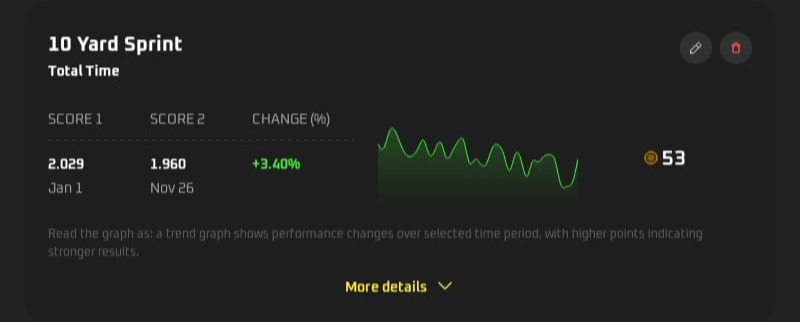
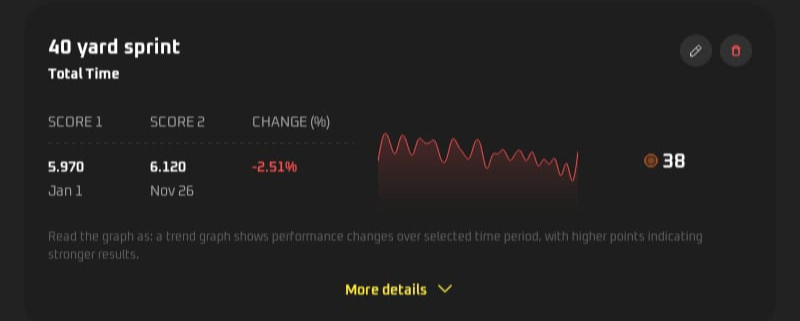
b) Monitor athlete's progress with trend graphs
The Trends section on an athlete's profile provides detailed insights into their performance over any chosen period (1 week, 4 weeks, month, year, or custom range).
For each drill/test, easily view athlete's:
starting score at the the beginning of the season,
ending score at the end of the season,
change rate over the training period,
score (0 - 100) that compares athletes with the team average.
Trend graphs provide a clear view of long-term trends and short-term variations, as well as fluctuations in scores.
Colors and change rates show progress or decline.
Scores compare results with team:
Green: above average
Orange: near average
Red: below average
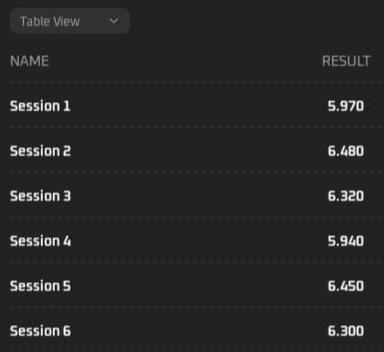
Additional tables and bar charts in the "More Details" section provide exact scores from the trend graph. Go into the details to pinpoint those reps where something changed to identify the cause and take action — whether it's a measurement error or a genuine decline.
c) Benchmark athletes against the norms (BETA)
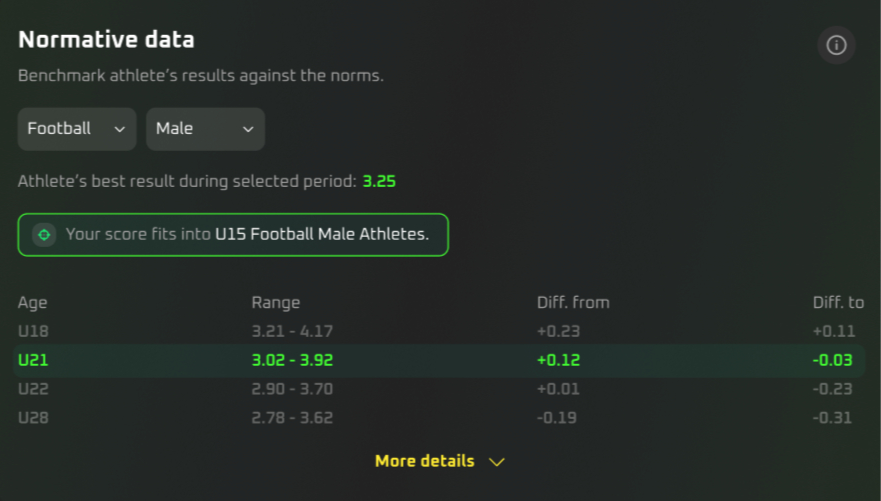
Sportreact Plus compares each athlete’s best results in each drill to the normative data for their sport, age, and sex from relevant sources. The norms table shows data for athlete's age and higher age groups, marking "green" all ranks the athlete fits. This lets you quickly identify those players who are outperforming their age groups. Sportreact Plus also calculates the difference between the athlete’s results and the normative range for higher categories, showing how much progress they need to advance to the next group.
*Normative data is available only for standard tests, sourced from relevant scientific articles that have generated and validated it.
Benchmark against the norms is available for following tests:
Sprint Test 10-20-30 Meter
T Agility Test
Arrowhead Agility Drill
20 Meter Agility Test (5-10-5 Test)
505 Agility Test
Sprint Test 15-30 Meter
Zigzag Running Drill
Cone Agility Test (L Agility Test)
Illinois Agility Drill
For the following reactive tests, reference values are determined based on the average performance metrics of athletes utilizing the application:
Stop'N'Go Reactive Agility Test
Y-Agility Test
d) View all personal bests in one place
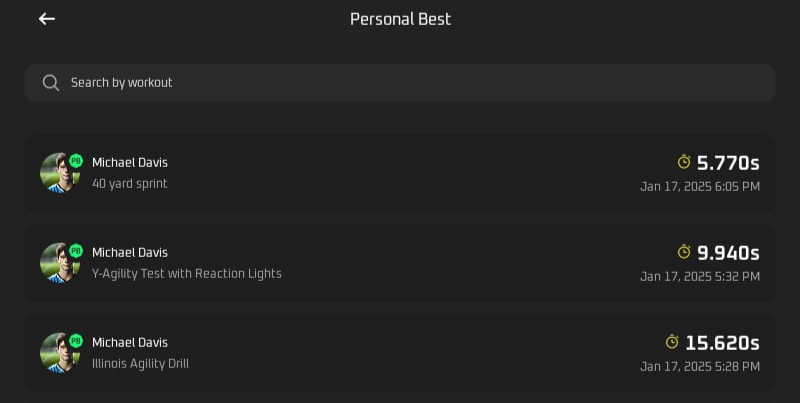
The personal bests section displays each athlete's top scores across all drills on a single screen. The search function lets coaches easily find specific results, including the exact data and time of each session when the personal bests were achieved.
e) Compare athlete to team-wide data
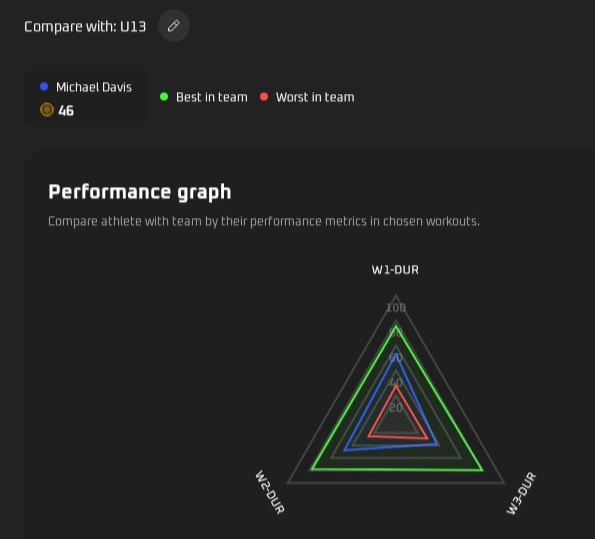
By saving data for each athlete, coaches access team-wide calculations such as team averages, and scores of highest and lowest performers. Athlete analytics provide a quick overview of each athlete’s results compared to the team, across multiple drills and selected metrics, all displayed in the performance graph.
To compare athlete to team-wide data:
Select the team you want to compare your athlete to.
Choose two or more drills you wish for assessment.
Select a metric for each drill (For sprints: total time, velocity, power, force. For hits: total time, number of hits, min, max, average).
Set the period for comparison.
The athlete's score (t-score, 0-100) is the average of their selected drill scores, standardized to team's results. This gives a clear view of how the athlete compares to the team average. A score of 50 is average, so anything over 50 indicates above-average performance, and below 50 reveals lower performance than the team's average.
f) Easily visualise data with spider graphs and charts
Performance graph is a simple visualisation based on the athlete's score showing how they rank relative to:
✓ highest and lowest performers
✓ in each of the selected drills/tests.
2. Compare Athletes:See How They Stack Up
Sportreact Plus allows you to compare multiple athletes based on their performance across multiple drills.
Use athlete comparison to:
Rank athletes across multiple drills using standardized scores (T-scores, 0-100).
Visualize skill balance with spider graphs.
Compare performances over different time periods to measure improvements.
Meet "Compare athletes"
a) Select all key info
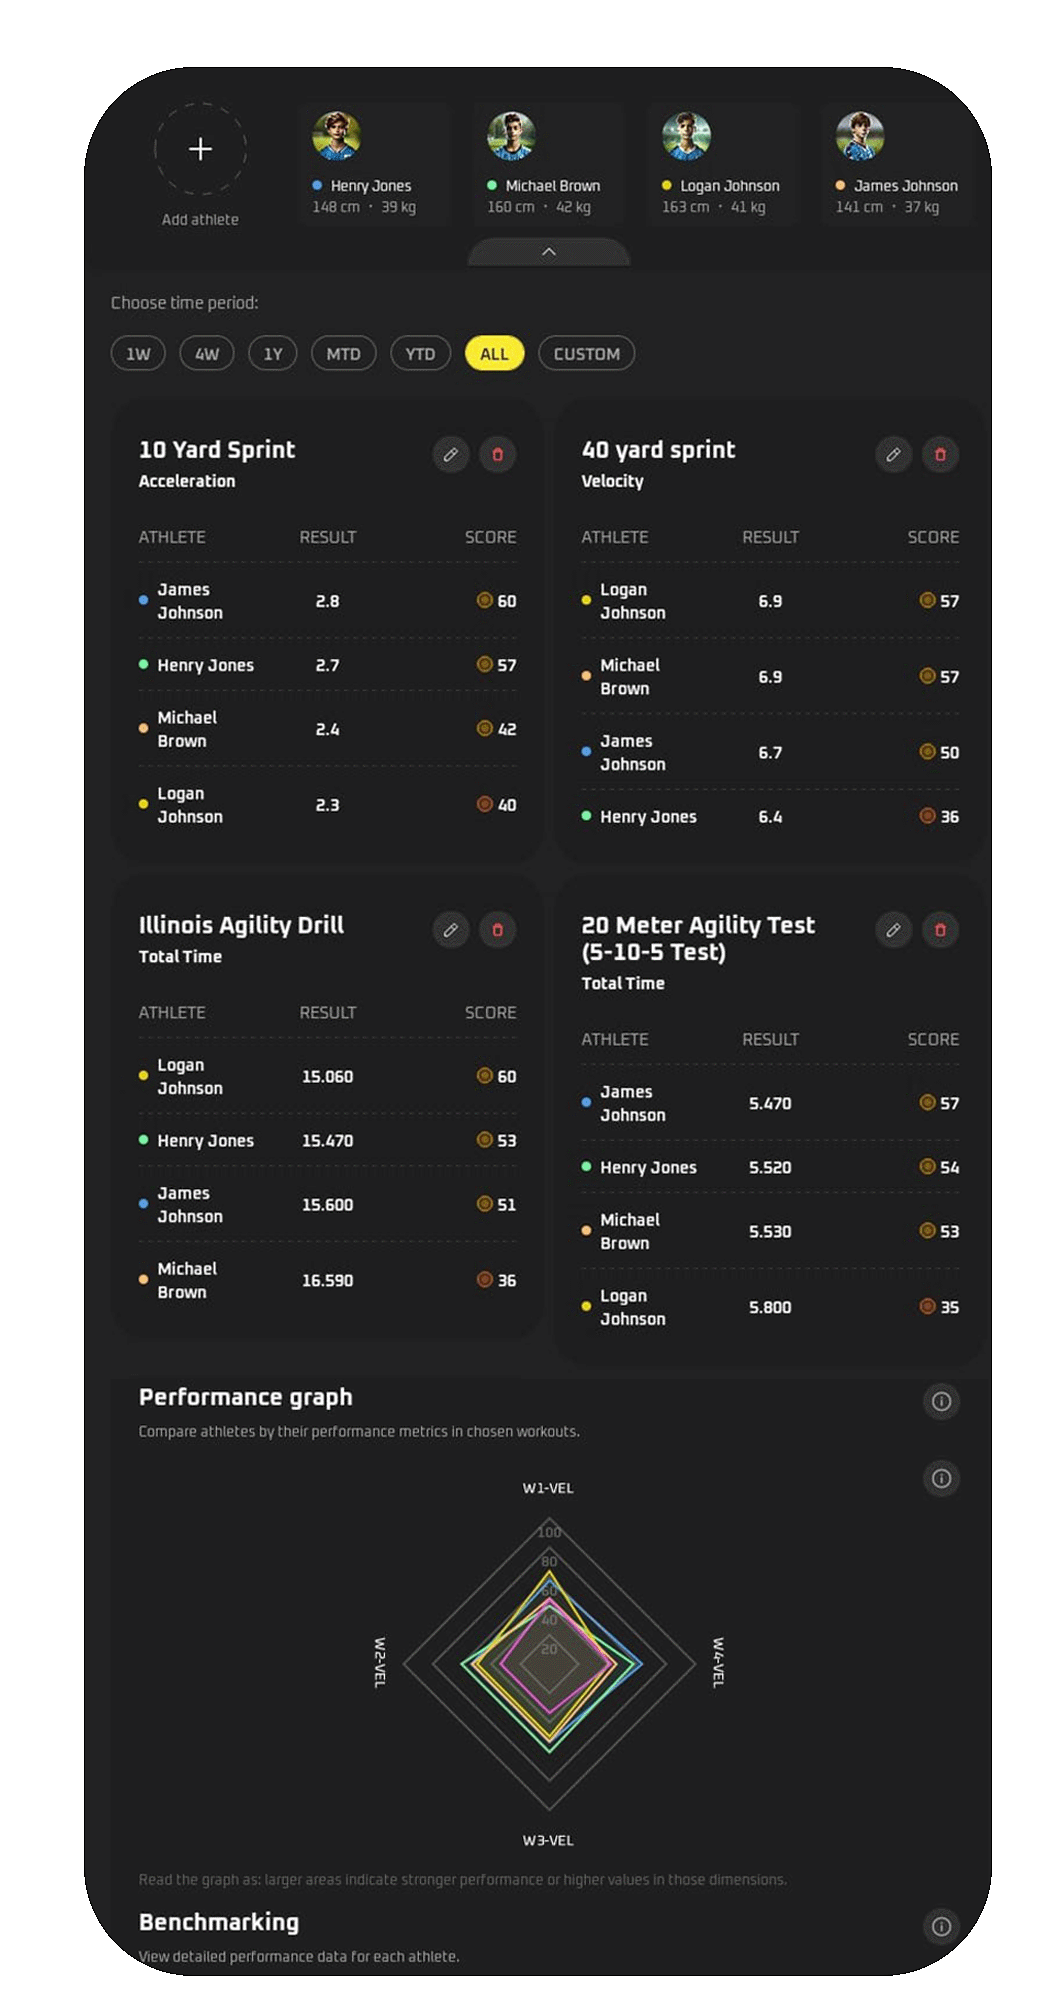
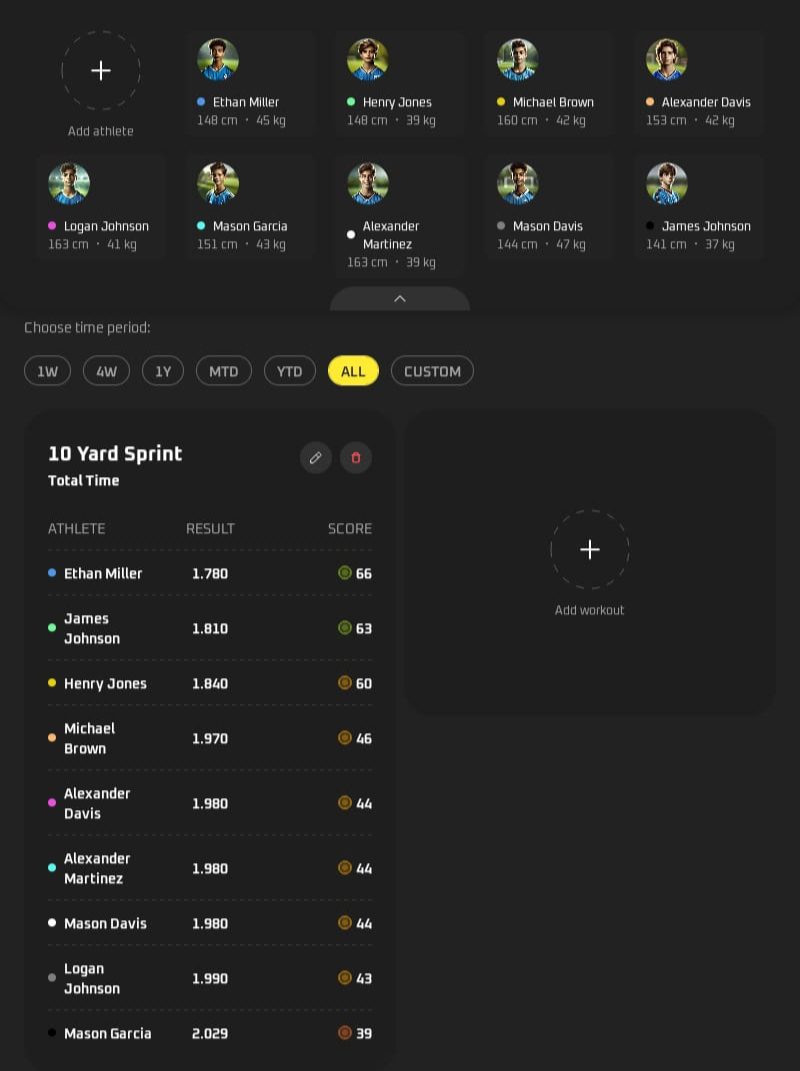
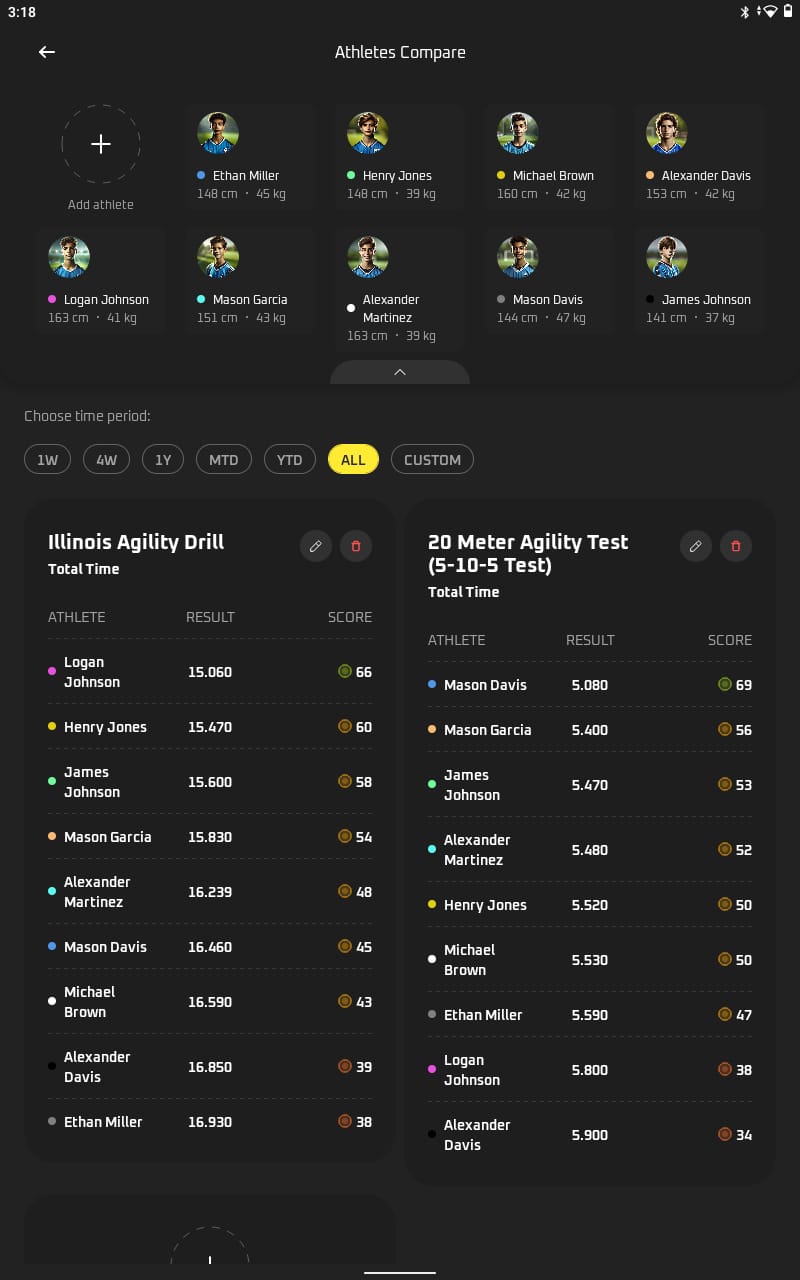
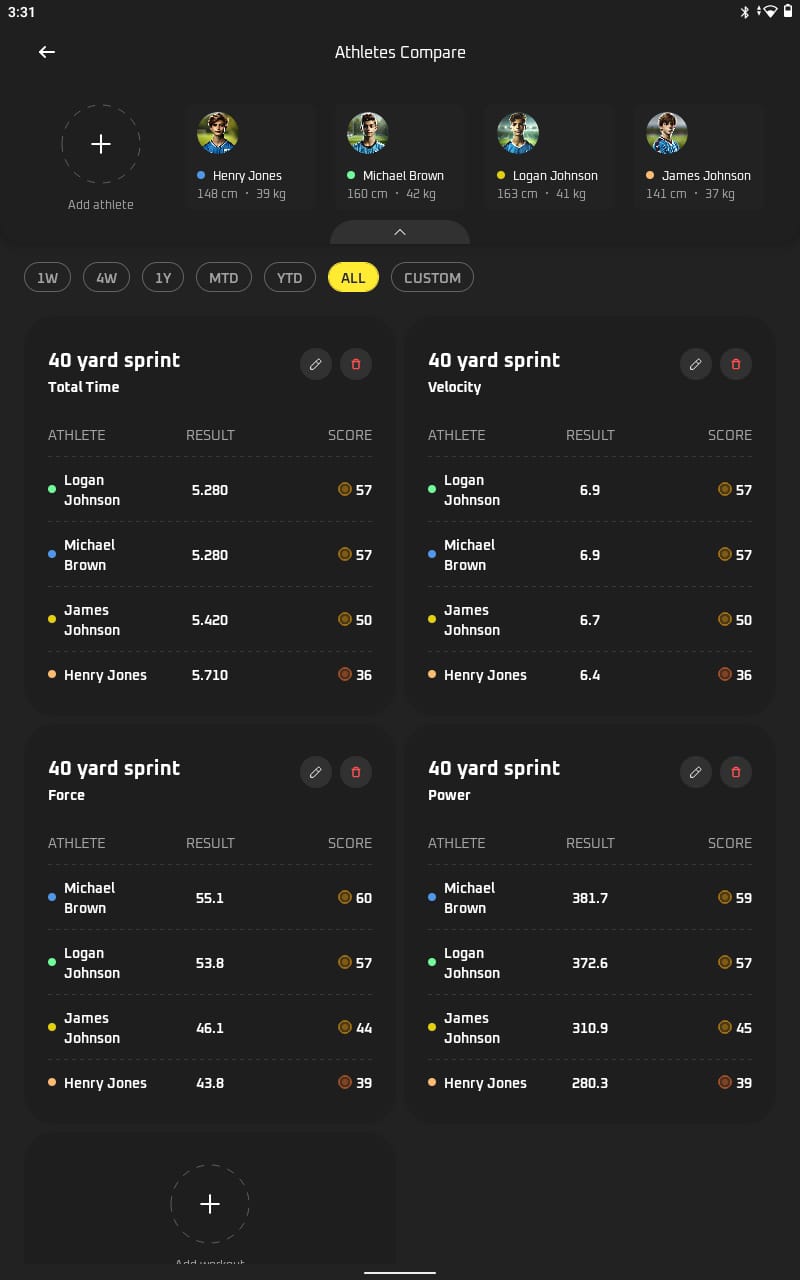
The Athlete Comparison report includes:
Athlete identification:
name, photo, weight, and height
colour tags correlating with the names in the leaderboard below for easy comparison
Time range for comparison:
selected time period determines which reps/results the app uses for comparison
Drill cards consisting of:
selected workout, metric and tag
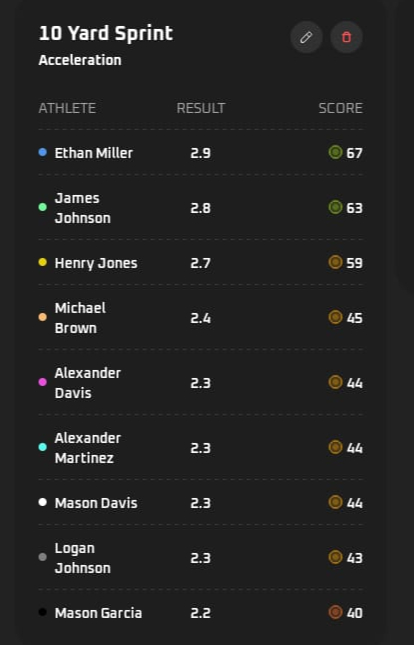
leaderboard with athletes's names and results in chosen metrics and relative scores
INFO: How are athletes ranked in every drill card?
Each drill leaderboard ranks athletes by:
Athlete's best result within the selected time period.
Results are displayed in selected metrics. For sprints you can choose between: total time, acceleration, velocity, power and force. For reaction drills: total time, hits, fastest time, slowest time or average time.
Athletes scores relative to the groups' average.
Athlete's drill scores are calculated as standardized t-scores (0-100), adjusted based on the group's average for the selected drill and metric, reflecting how each athlete stands relative to the group.
b) Customise reports: rank athletes across multiple drills and metrics
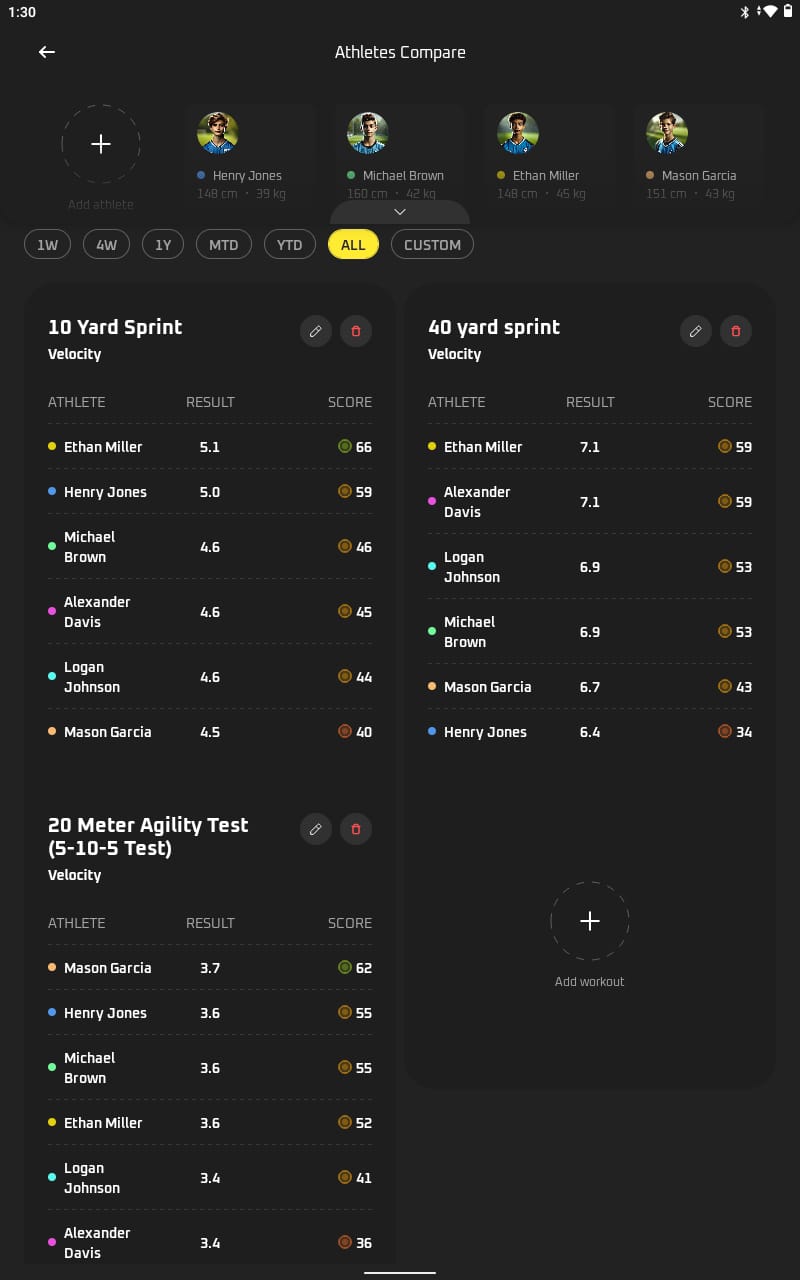
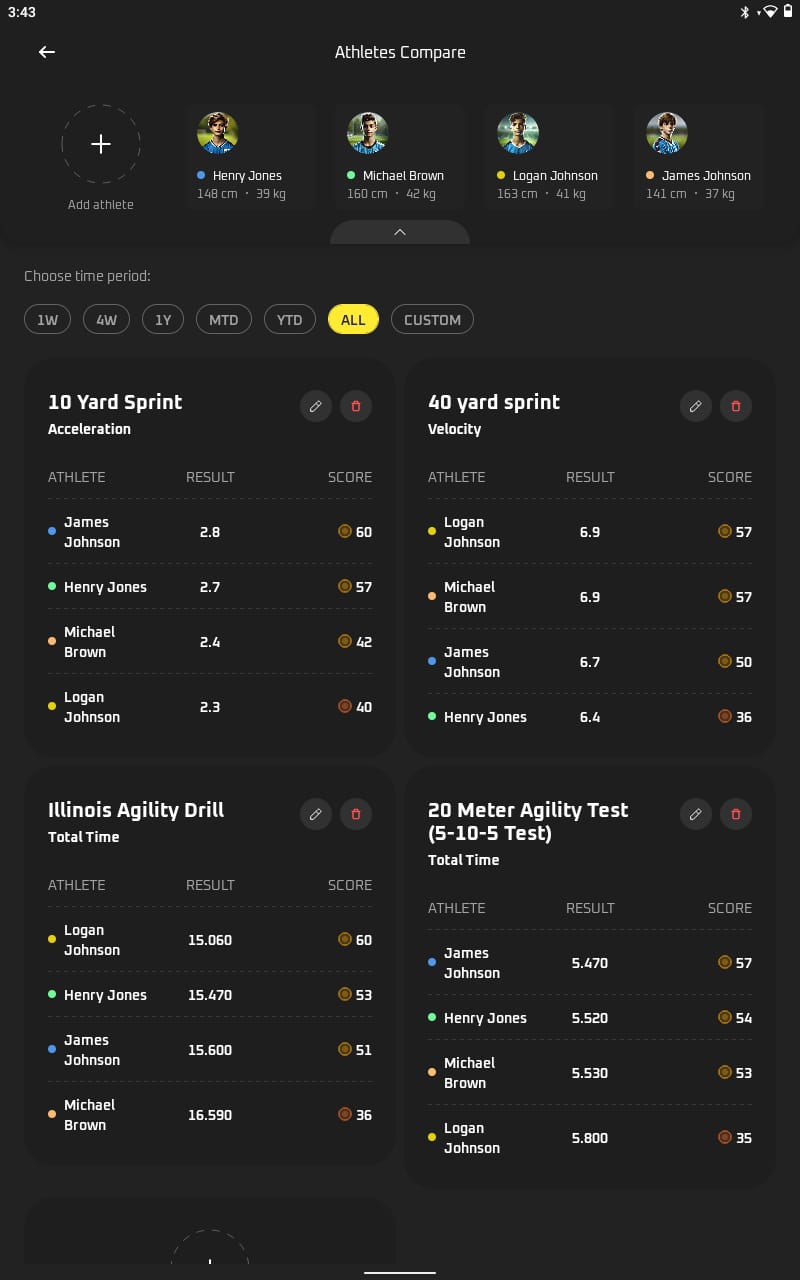
Sportreact Plus allows coaches to select several workouts when creating a report, and easily do cross-comparations and rankings.
See examples below to view how you can use athlete's compare:
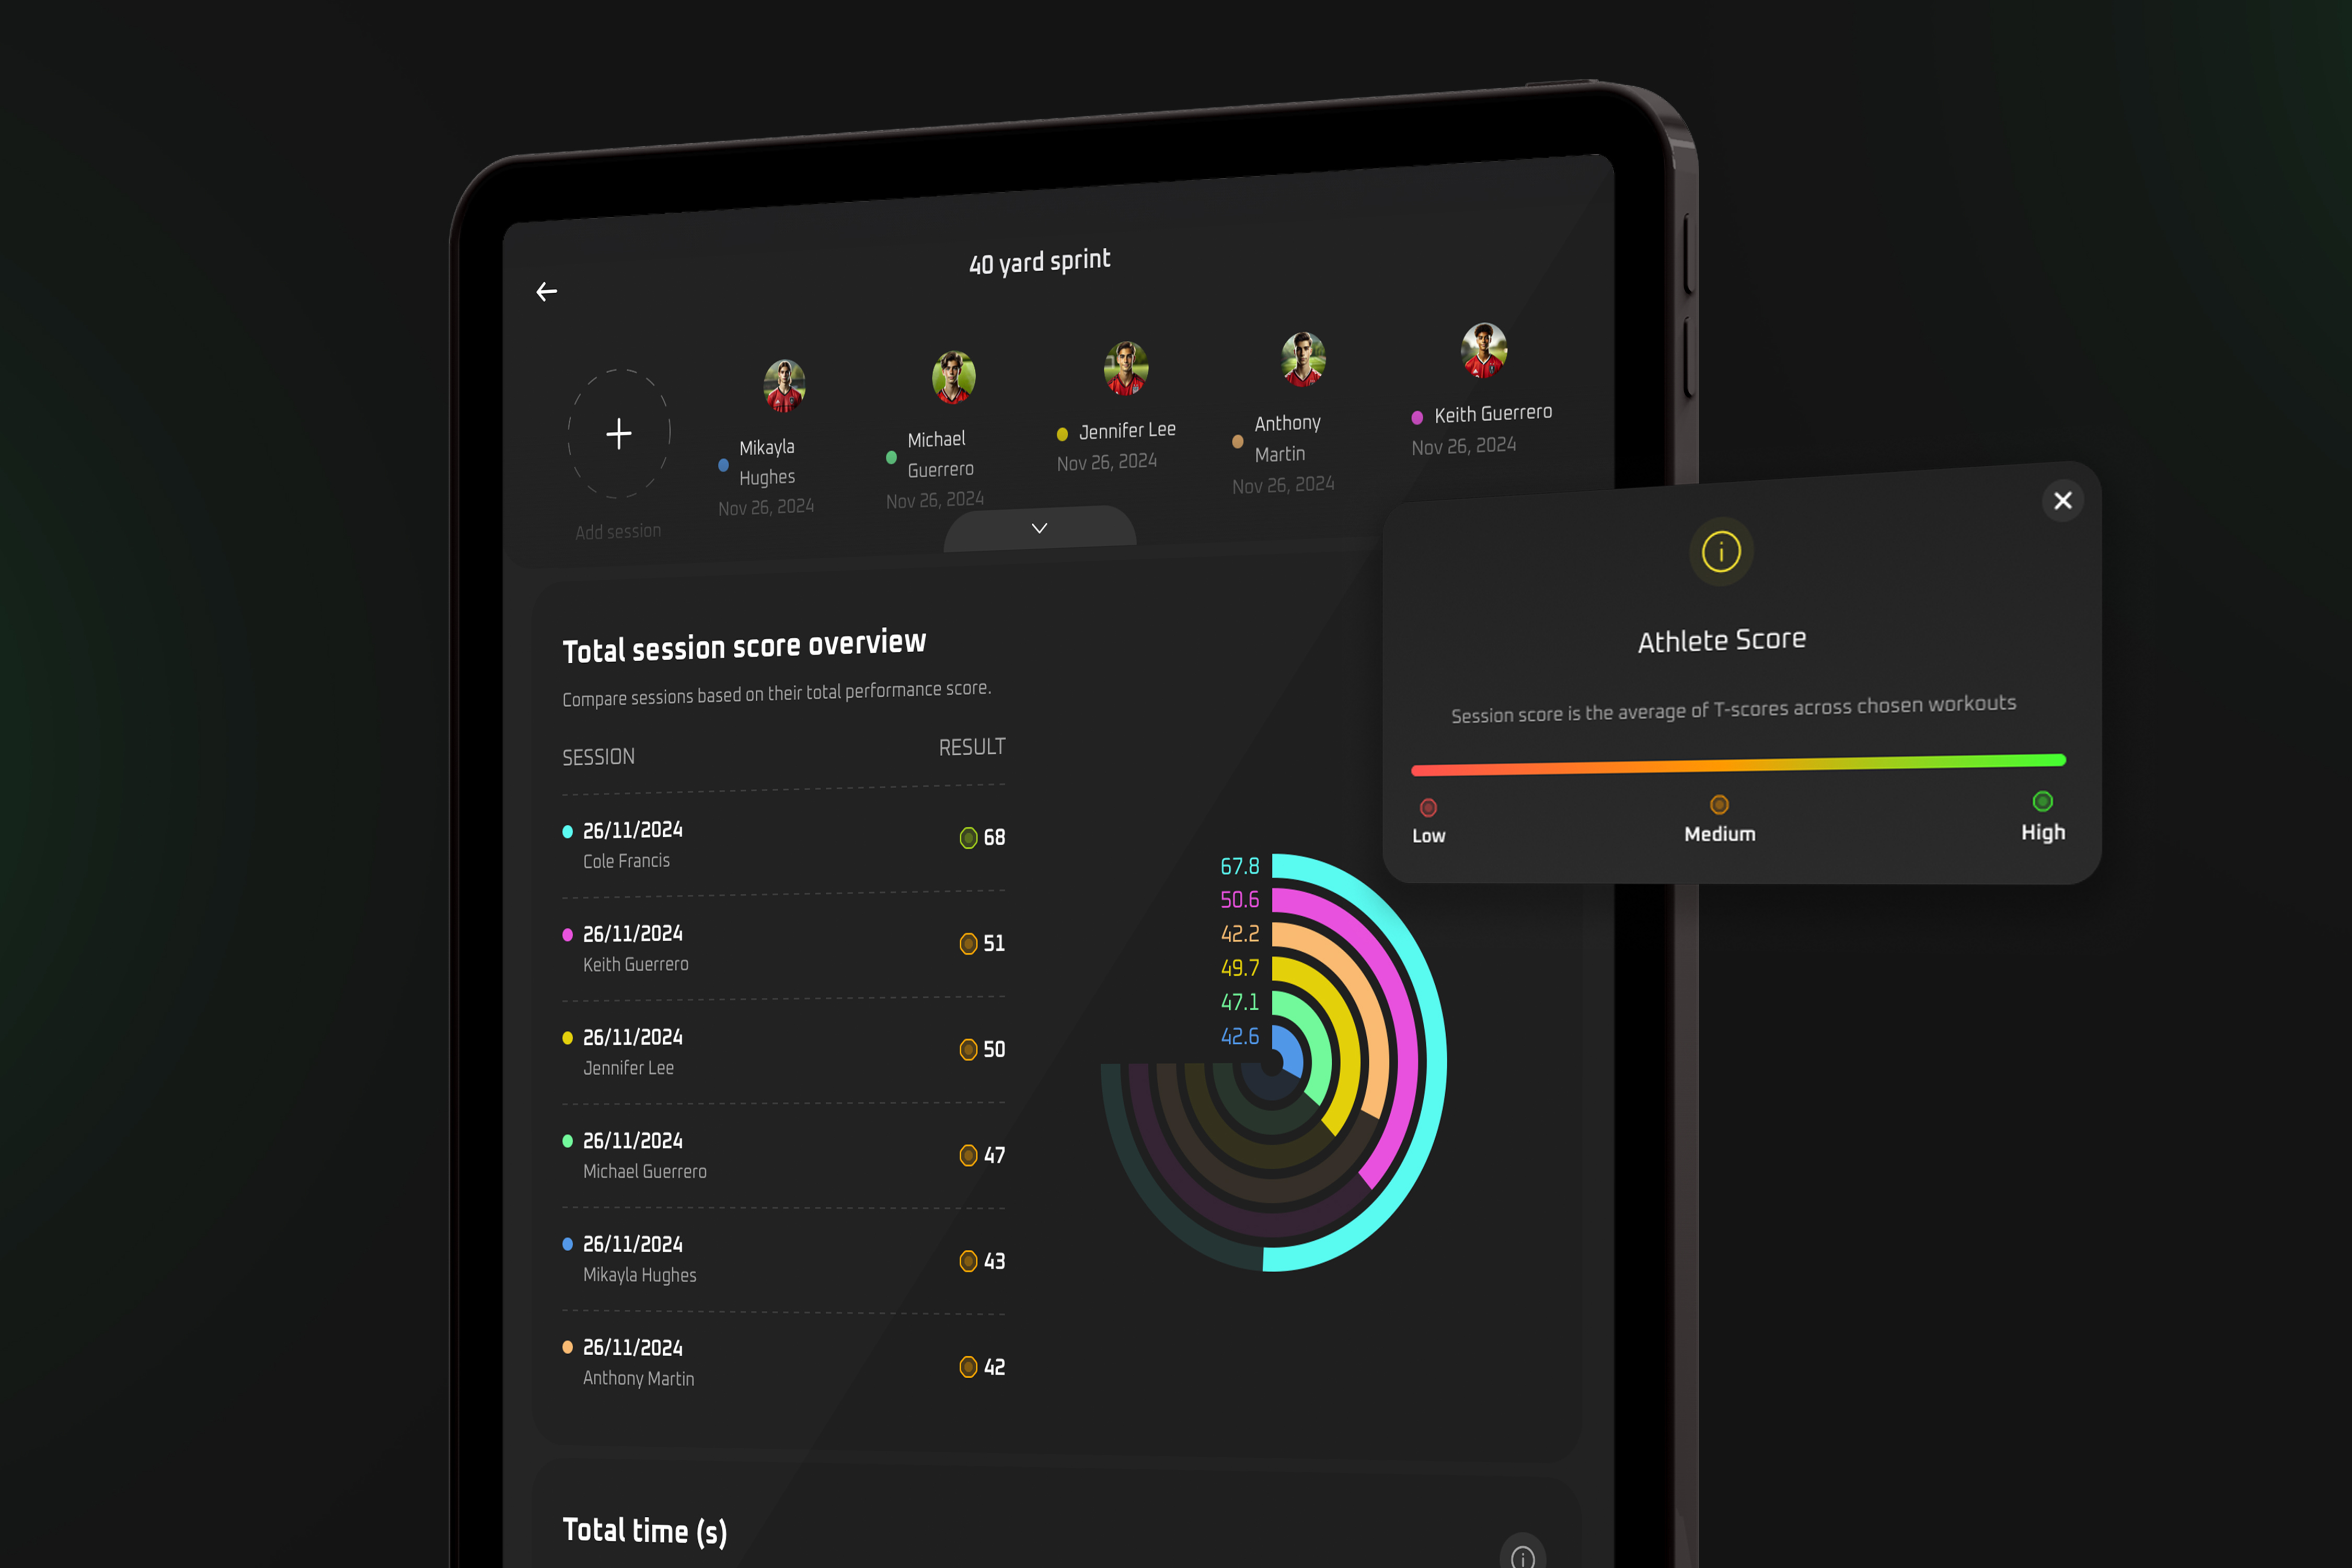
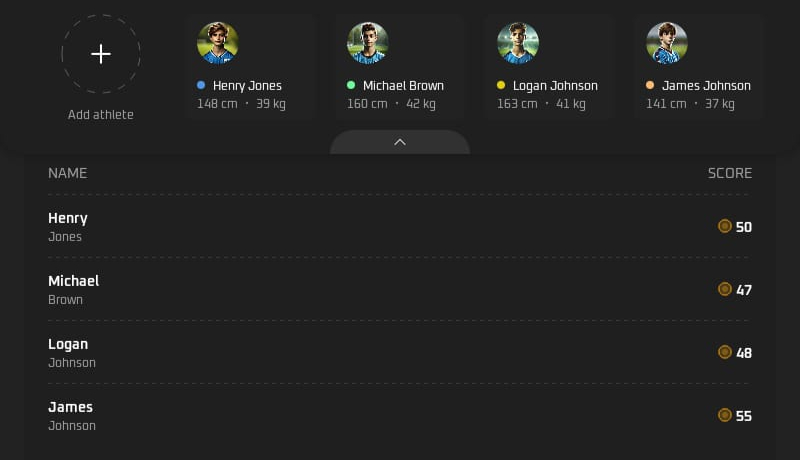
c) Athlete scoreboard: view overall ranking
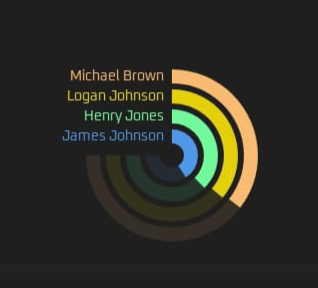
The Athlete Scoreboard ranks athletes based on their total results across the selected drills and metrics, providing a final overall ranking. Scores are calculated as the average of previously selected drill scores.
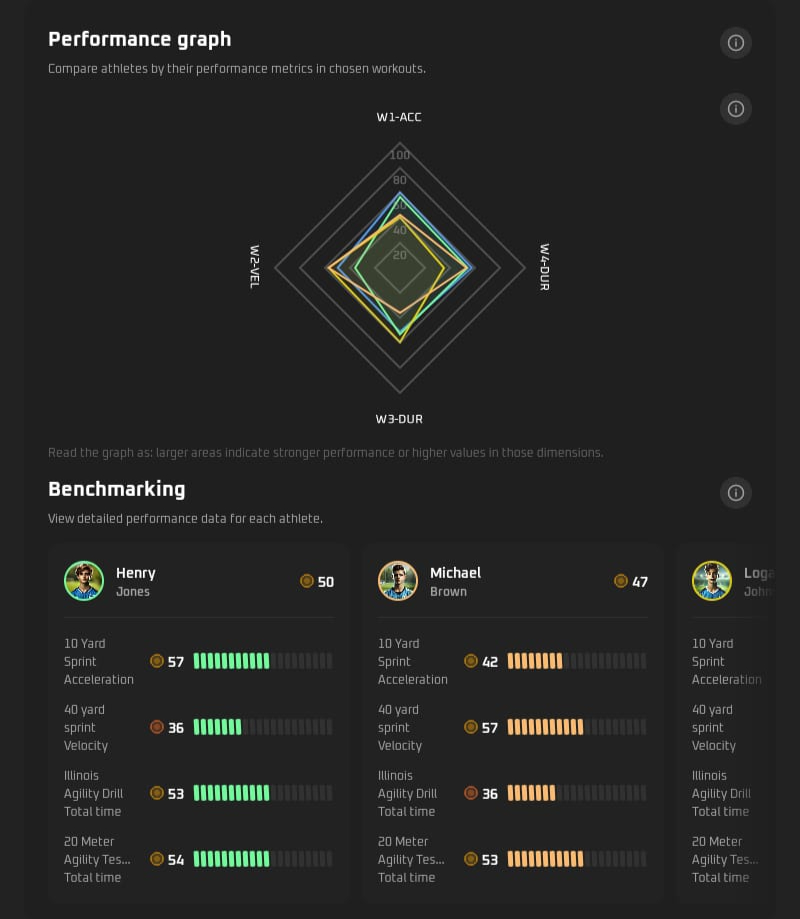
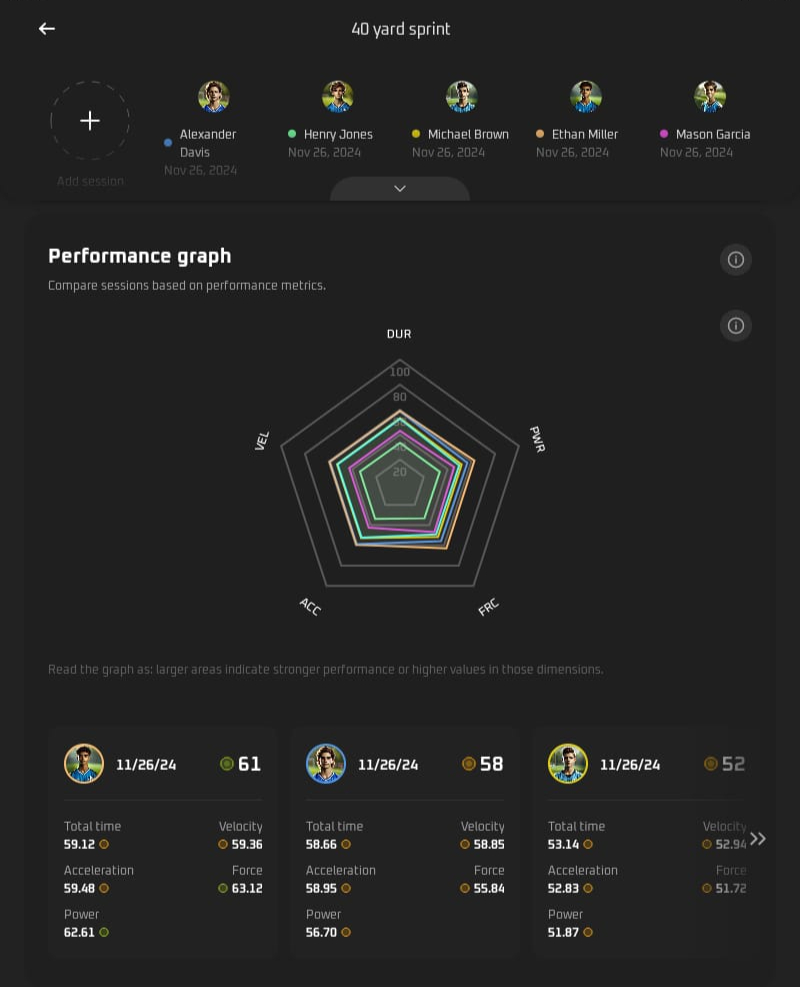
d) Quick performance overview: compare on spider graph
Different change of direction (COD) and agility drills measure distinct aspects of performance, making direct numerical comparisons less meaningful.
The radar chart recognizes this, offering a qualitative, visual assessment rather than a rigid mathematical ranking. Coaches can quickly identify well-rounded athletes with balanced skills or pinpoint specific deficiencies that need improvement.
The radar chart uses drill scores, which are displayed in athlete cards. The scores are calculated as standardized t-scores (0-100), adjusted based on the group’s average for the selected drill and metric, showing how each athlete performs relative to the group.
3. Team Analysis: Get the Bigger Picture
Team Analysis provide a comprehensive snapshot of your team's performance across various drills and metrics. This allows coach to quickly assess group averages, rank athletes by their performance, and track progress in each drill over time.
Use team analysis to:
View team-wide trends in sprints, agility, and reaction drills.
Benchmark athletes against team averages, highest, and lowest performers.
Access drill leaderboards and percentile-based rankings.
Meet "Team analysis"
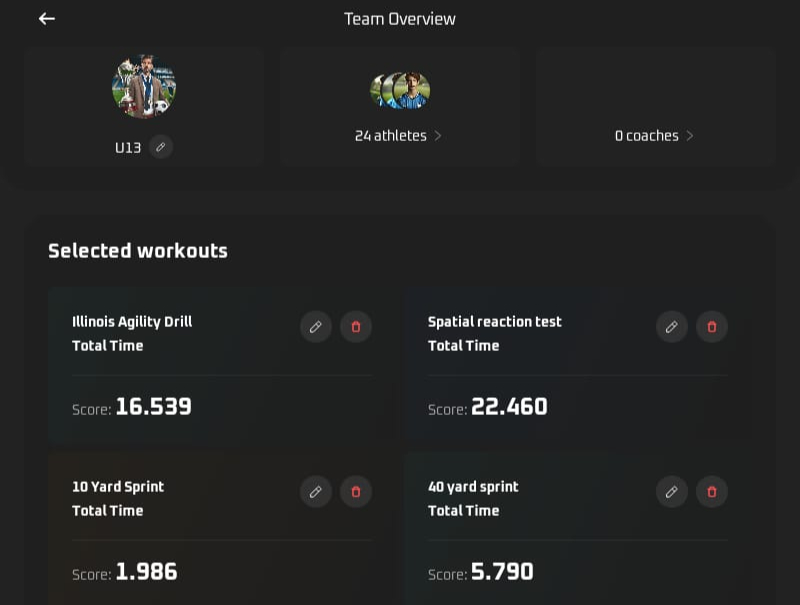
a) Choose the team and drills
Select multiple drills you want to view progress for:
sprints,
COD and agility drills,
reaction drills.
Quick averages: next to each drill name, view an average result of your team during the chosen timeframe.
Sportreact Plus lets you dive deeper into team analytics for every test/drill:
b) Get quick stats
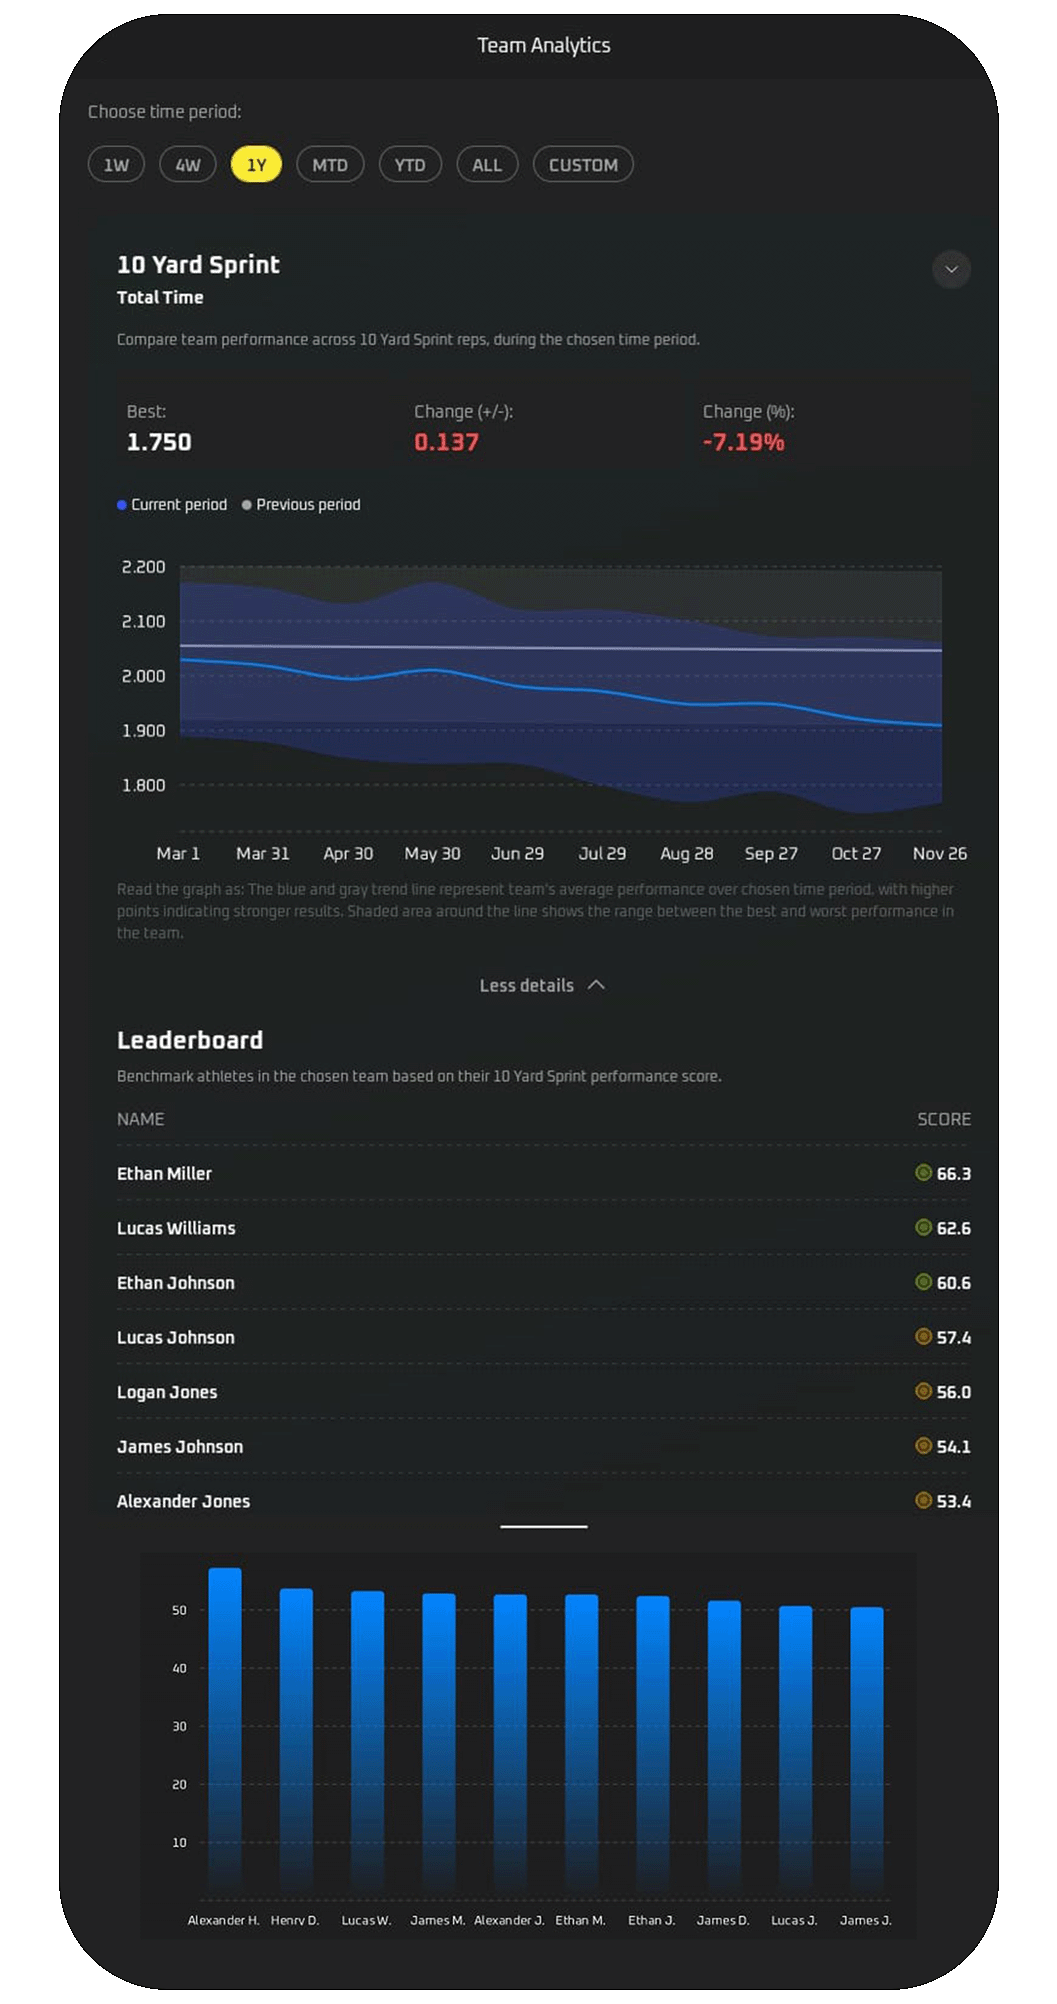
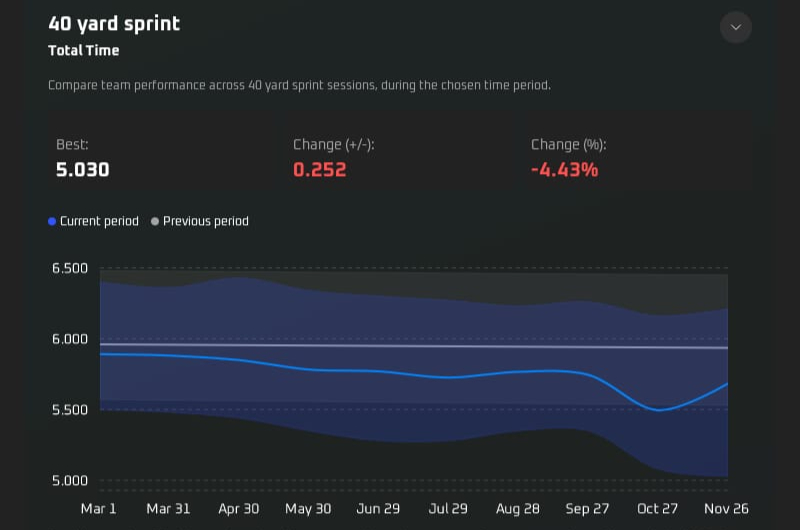
Drill cards in team analytics show you:
the best result in your team
change during selected period expressed in metrics (total time, velocity, acceleration, force, hits etc. depending on the drill)
percentage change rate.
c) Monitor trends on graphs
The blue line are the average results over chosen period, while the light blue area shows the distribution of min and max results.
The light gray indicates the comparison with the previous period.
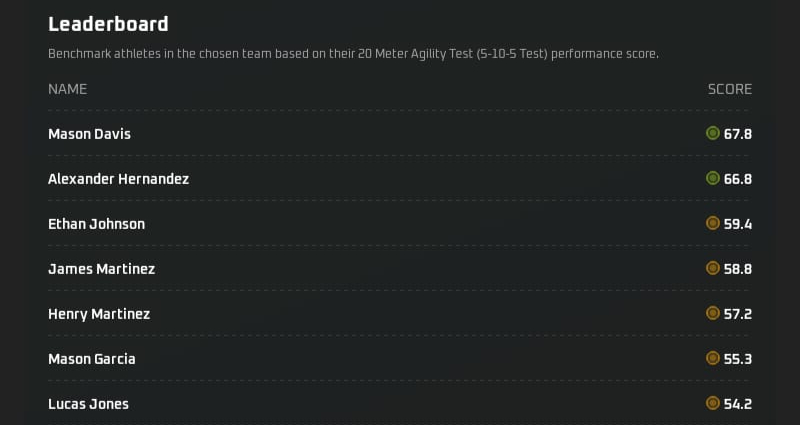
d) View quick ranks for each drill
Below each workout is the leaderboard ranking athletes based on drill scores calculated using your team's averages.
Athlete's drill scores are calculated as standardized t-scores (0-100), adjusted based on the group's average for the selected drill and metric, reflecting how each athlete stands relative to the group.
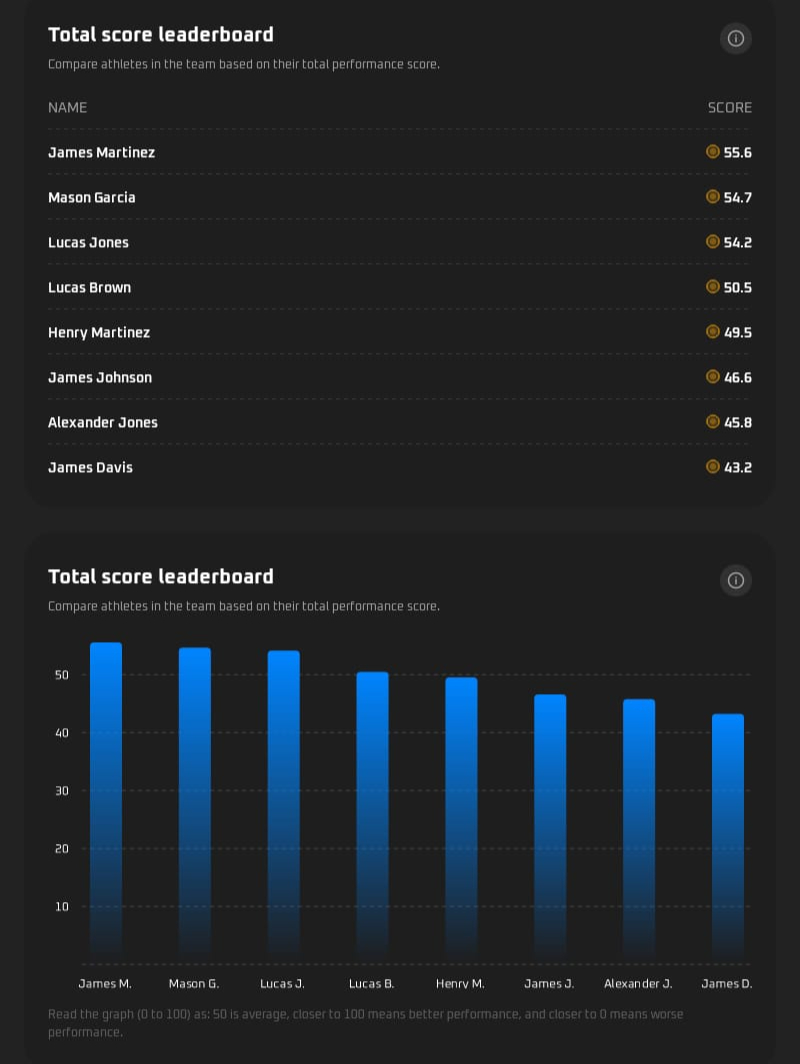
e) View quick ranks for each drill
The Team's Scoreboard ranks athletes based on their overall performance across selected drills and metrics in the chosen time period, offering a final ranking and comparison to the group's average.
Scores (T-scores, 0-100) are determined as the averages of previously selected drill scores, with 50 indicating the average performer and higher scores indicating better performance.
Bar charts offer a visual interpretation of the Team's Scoreboard.
4. Activity Report: Catch Every Detail
Sportreact Plus goes beyond standard results tracking by analyzing every training session in detail.
Compare:
One Athlete - Multiple Reps: Analyze athlete's performance in detail by calculating their velocity, acceleration, force and power score for each rep, and easily rank them from highest to lowest.
Multiple Athletes - Multiple Reps: Compare how your team members rank against each other based on rep total times and metric calculations. *Similar insights can be achieved in Compare Athletes, discussed beforehand.
Use rep-by-rep comparison to:
Track every rep with in-depth analysis of hits, total time, and key metrics.
Use performance visualizations like bar charts, line graphs, and spider graphs.
Rank reps in real-time with leaderboard tables.
Meet "Activity Report"
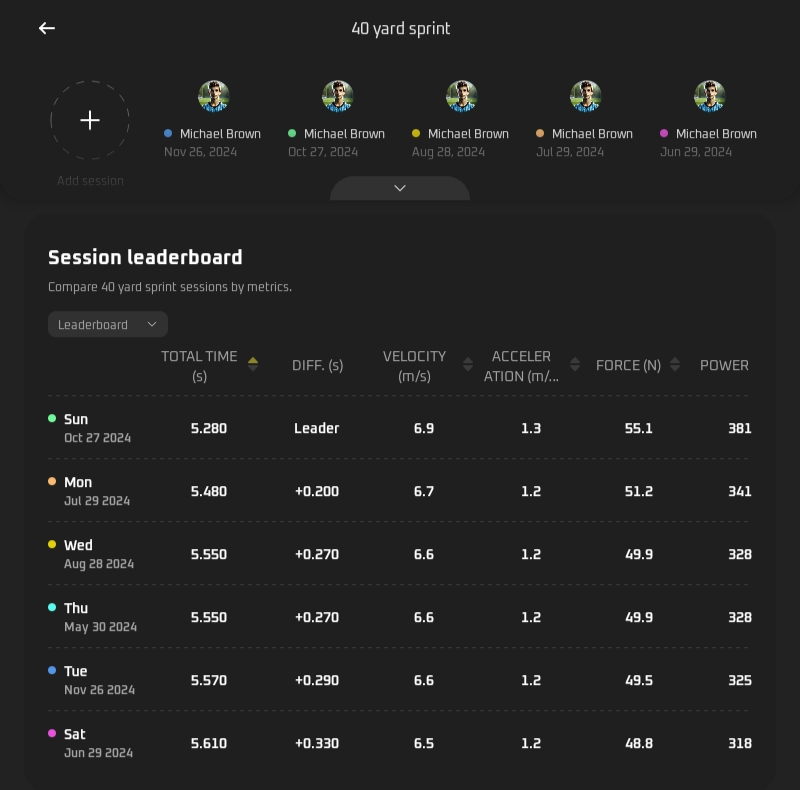
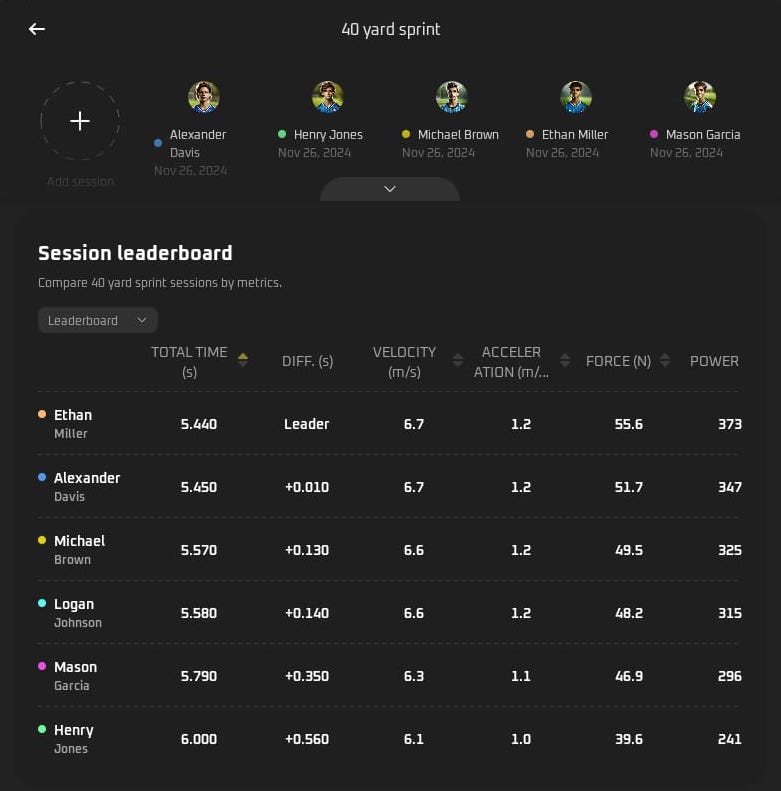
a) Rank reps quicker with leaderboards
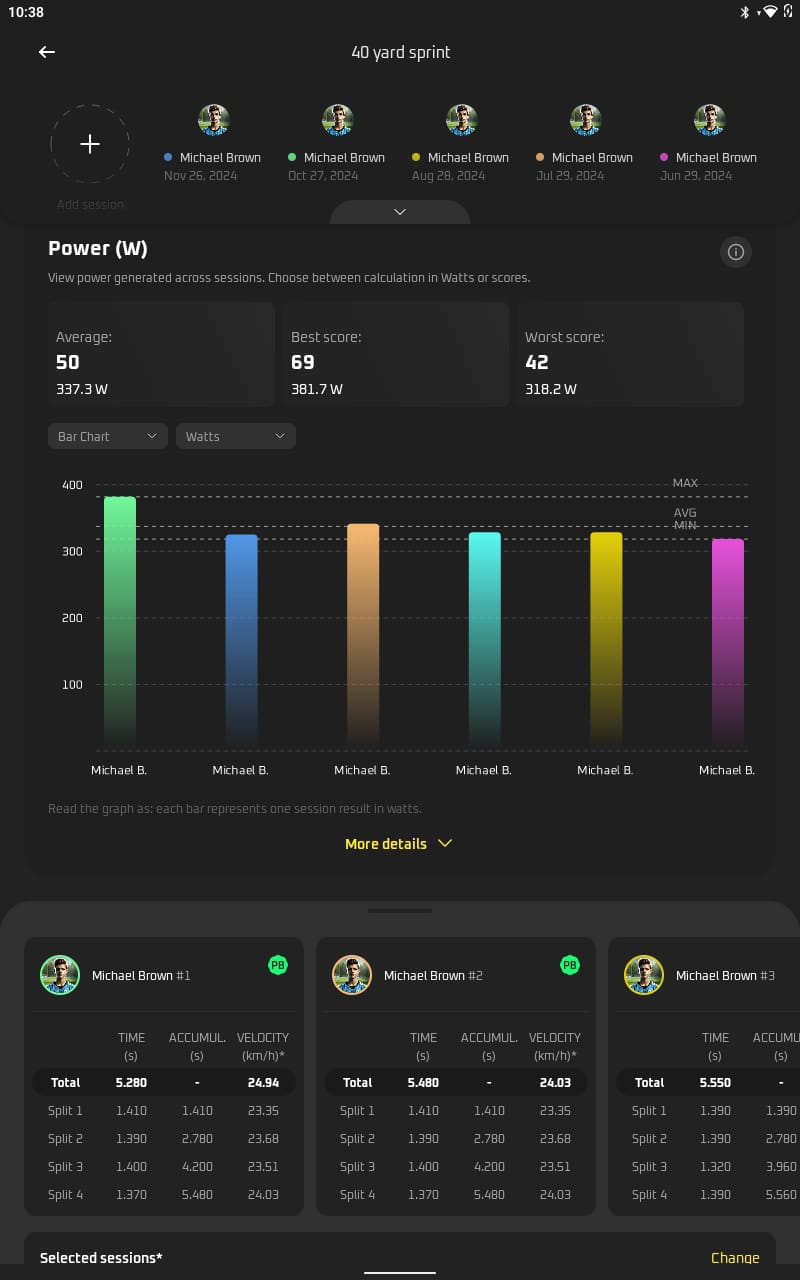
The leaderboard table allows comparison between multiple sprint or agility repetitions by key metrics such as total time, difference (s), velocity, acceleration, force, and power. Easily filter and reorder reps based on any of these metrics, whether are looking to view athlete's best rep by a specific metric, or wanting to rank multiple athletes by their fastest overall time, the highest peak velocity, or the greatest power output.
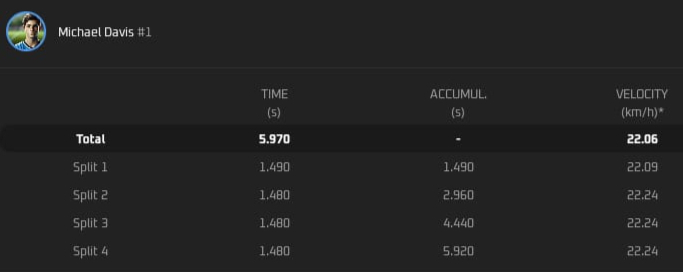
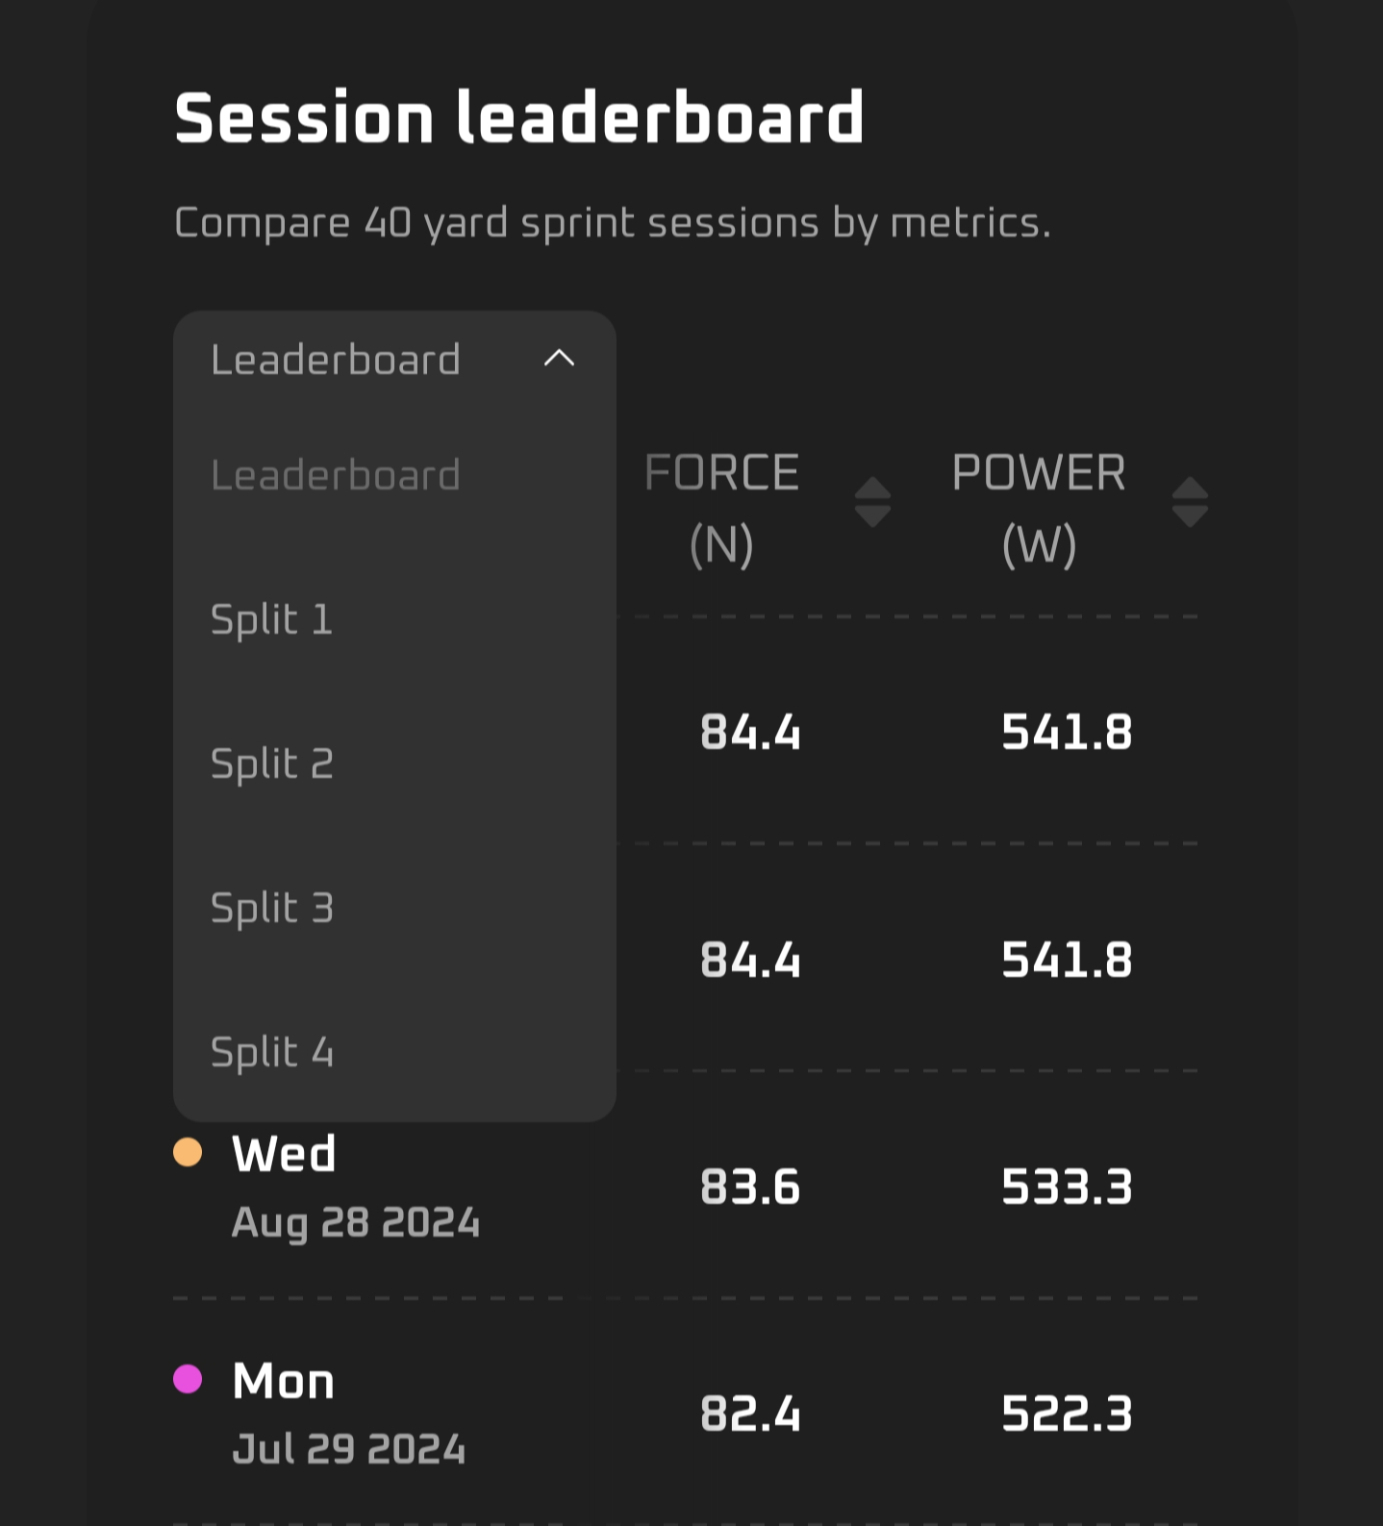
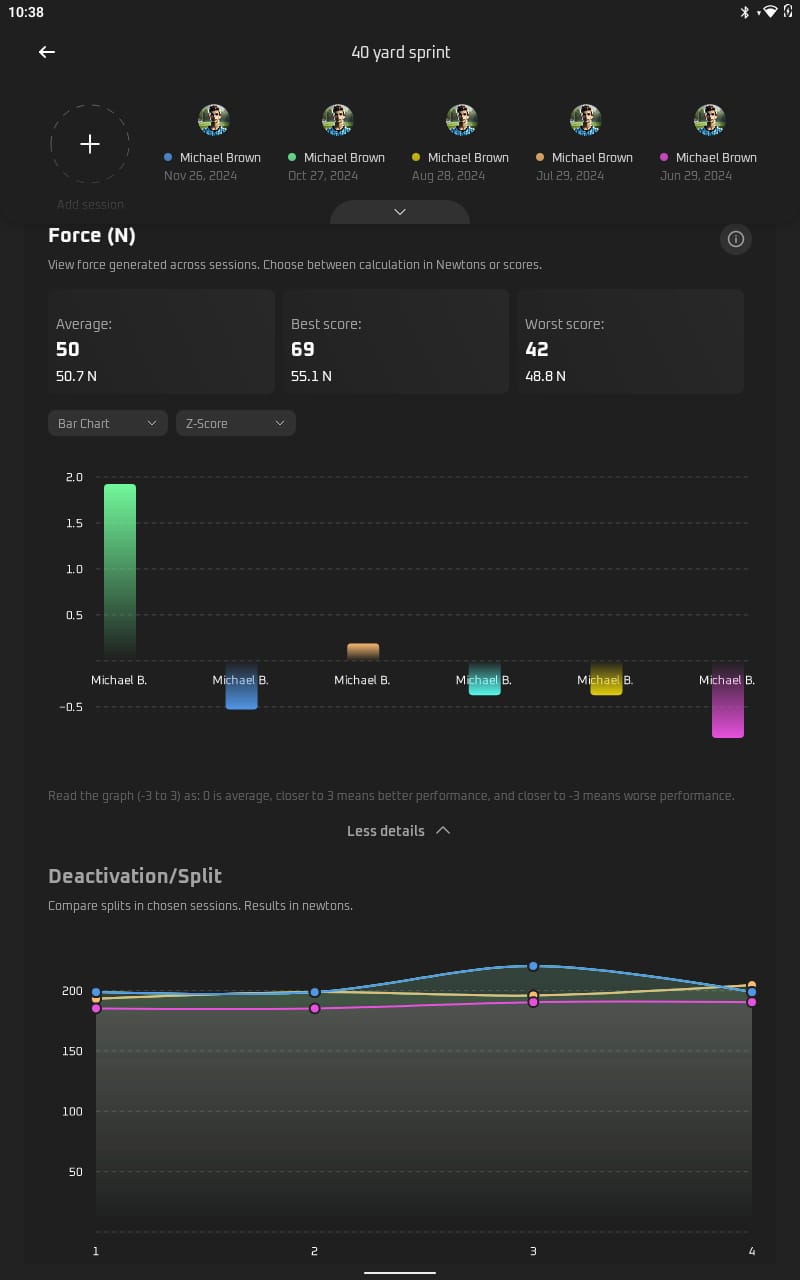
b) Split times analysis
Sportreact offers split timing functionality, allowing for a detailed analysis of runs.
Each Sportreact kit includes three sets of gates, and offers to combine up to six pairs of gates for precise measurements.
When analyzing runs with multiple gates (split timing), choose to calculate data based on total times or break it down by each individual split.
c) View deep insights on each metric
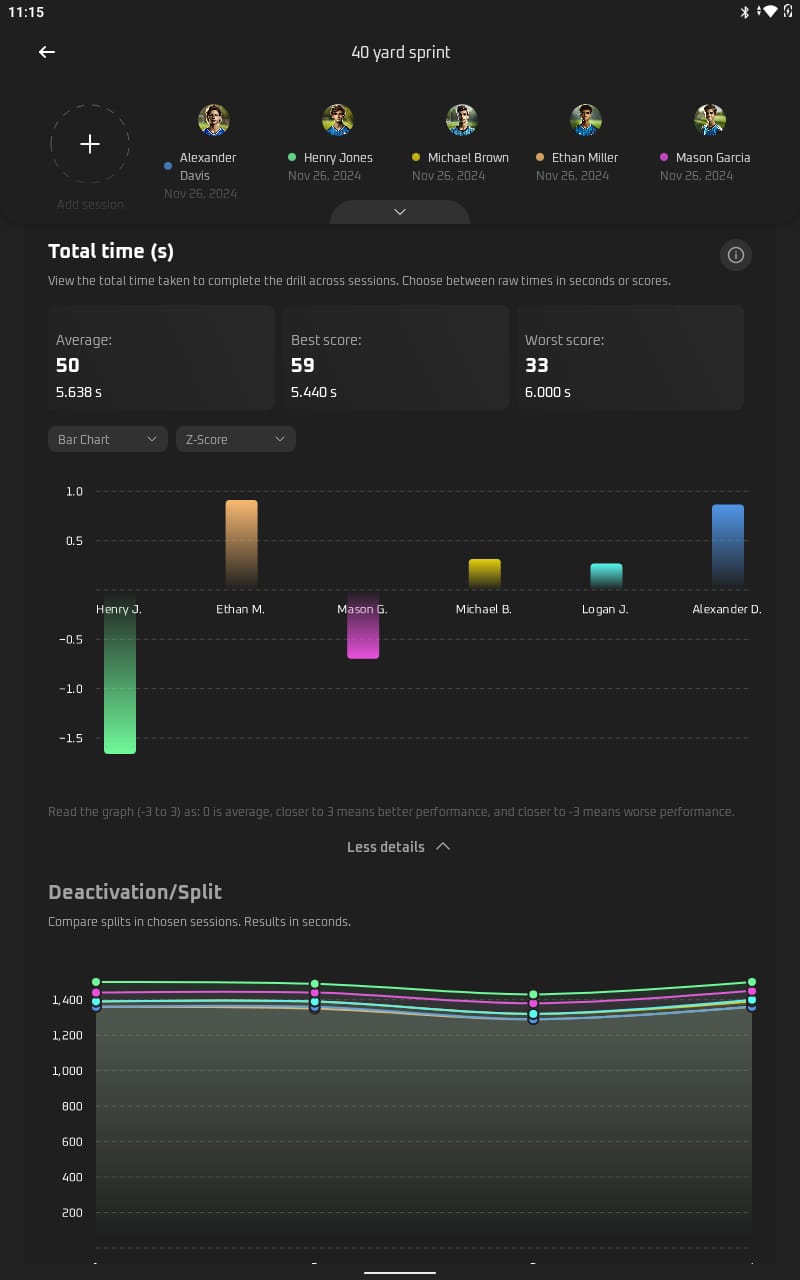
Comparing reps becomes even more detailed on metric cards. Each card shows average, highest and lowest rep, along with scores (0-100) relative to the selected group.
To view details and compare reps in detail, choose between Bar Chart or or Table View. Bar charts help visualise results in total times (s), or calculated scores (T and Z-scores). For tracking COD, agility or reaction drills or for closely examining splits, the results will be the clearest when shown in Line Chart, accessible under "View more" button.
To closely examine all the visualisation options "Compare reps" screen offers, please look at the pictures below.
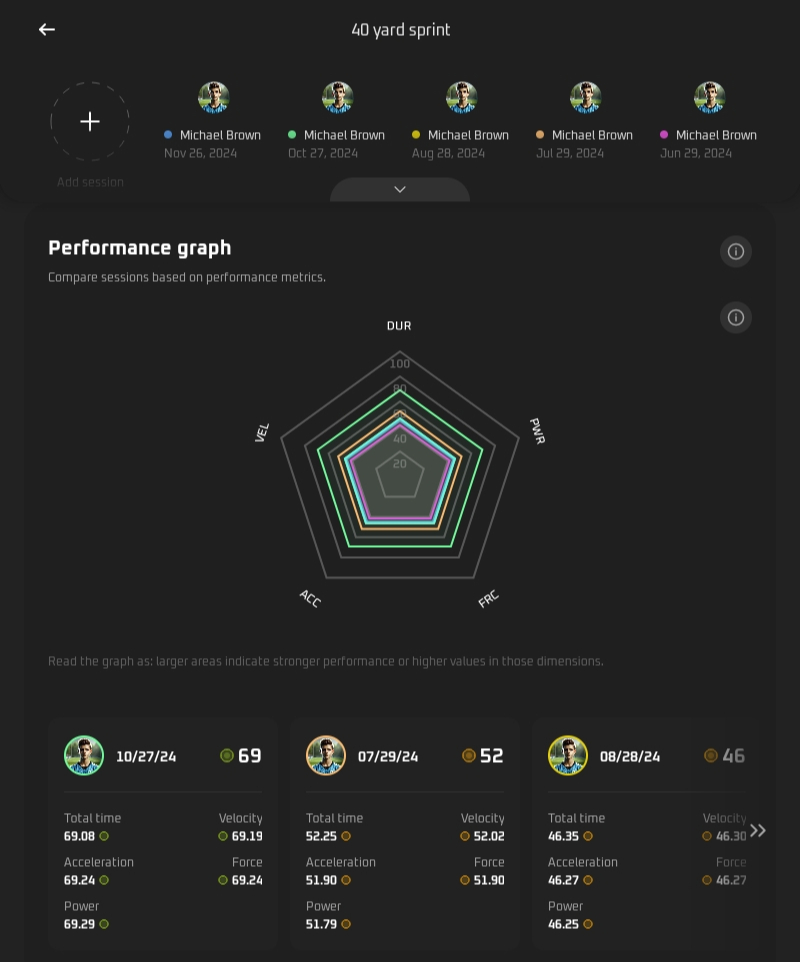
d) Compare visually with the performance graph
The Sportreact performance graph helps you visualize repetitions by key metrics:
For sprints: duration, velocity, acceleration, power, force, acceleration.
For reaction drills: total times, hits, min, max, average.
Each axis represents a score (t-score, 0-100), while color-coded lines show results of individual reps on each axis, offering a holistic view of performance in every rep.
In "Rep Cards" under the graph, see total scores for every rep, as well standardised scores for each metric: total time, acceleration, power, velocity, force or, when using reaction lights - for total time and hits.
Unlock Advanced Performance Insights with Sportreact Plus
For athletes and coaches striving for peak performance, tracking progress on session, athlete and team level is crucial. Sportreact Plus takes performance analysis to the next level by providing in-depth comparisons, quick ranking through scores, and powerful visualizations for instant feedback and informed decision-making.
If you’re ready to enhance your performance tracking, book a demo call with one of our experts and see how Sportreact Plus helps you give actionable insights, optimize training, and unlock every athlete’s full potential.
ANTO SIRIC
Meet Anto: the CEO of Sportreact, a cutting-edge sports tech startup, and a dedicated WAKO kickboxing athlete. With a passion for exploring innovative sports performance training routines, Anto continuously seeks to push the boundaries of athletic development.
Anto is featured in numerous local and international business accolades, including the "30 Under 30 Award" for the most successful young Croatian entrepreneurs, as well as in the "TOP 25 Croatian Startups."
Sign up to get your exclusive offer and start training better today.
Thanks for submiting! Check out your inbox and spam fodler for extra offer.
Oops! Something went wrong while submitting the form.
Thanks for submiting! Check out your inbox and spam fodler for extra offer.
Oops! Something went wrong while submitting the form.
By signing up, you accept our privacy policy. Your personal data will be processed so that we can contact you about our products via email or WhatsApp. Read our Privacy Policy for more information.